
Drag to move. Right drag to turn. Scroll to zoom. Click a planted tree for its numbers.

Loading the point clouds
June 2025 to October 2026, by LiDAR. A larger circle is a larger change. Select a tree for its numbers.
Every tree, both years
Select a column heading to sort. Select a tree to see it in 3D.
Height runs from the ground at the trunk to the top of the crown. Crown area is the crown seen from above. Both are measured from the LiDAR points of each tree, the same way in both years. The full table, with more columns, is part of the data delivered to OUR Community Forestry.
How it was made
Two flights
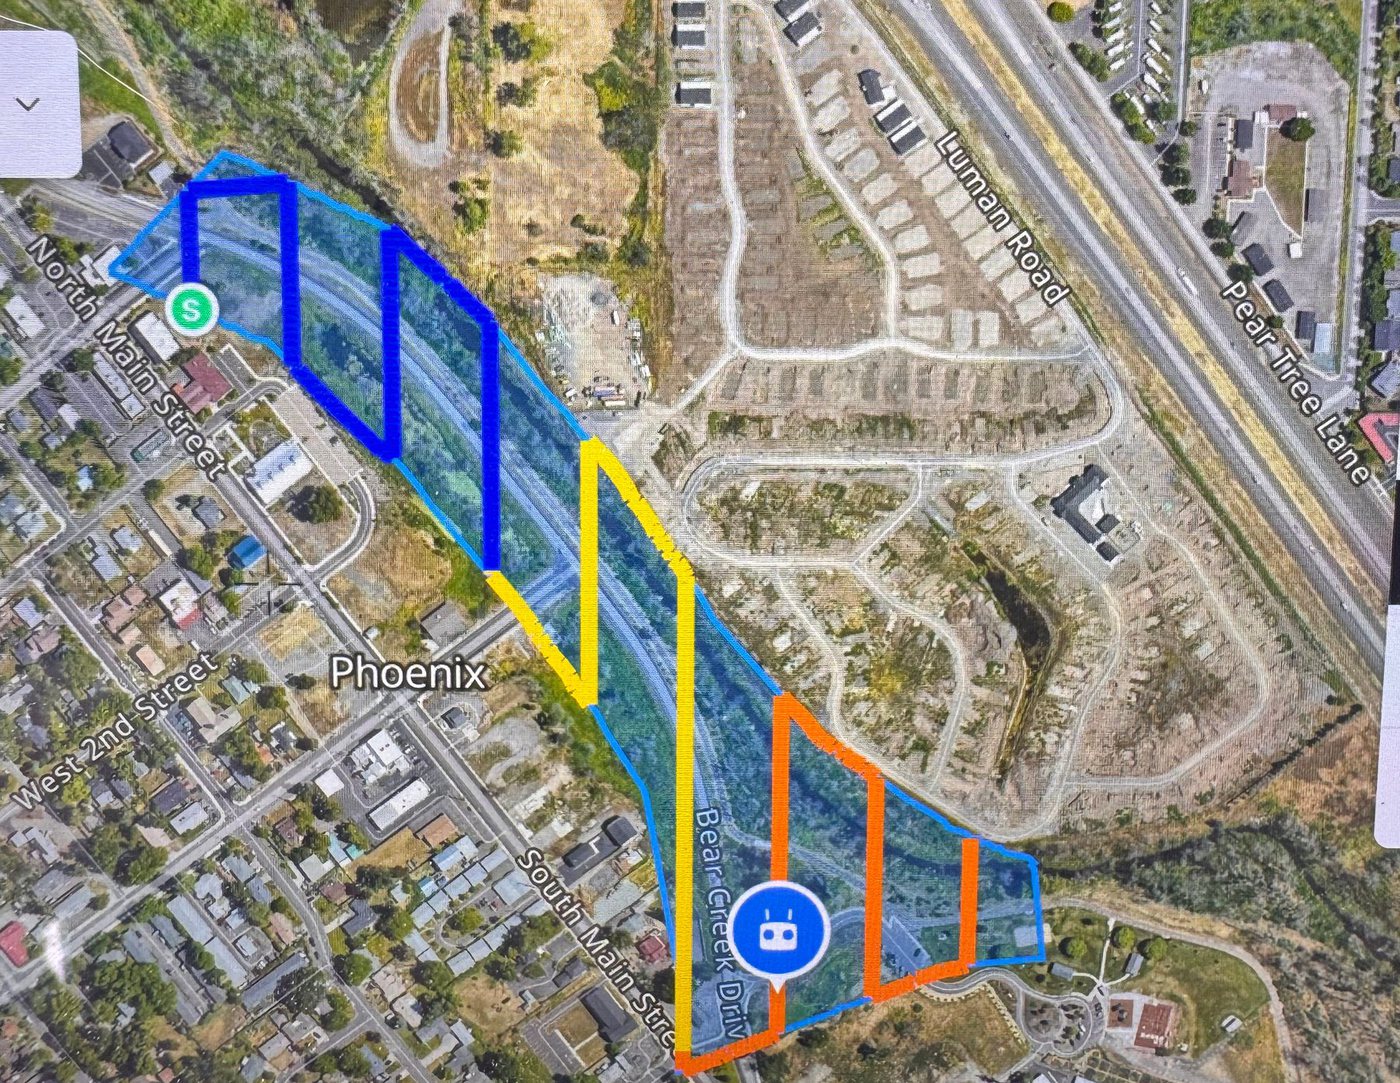
A drone carried a LiDAR scanner and a camera over the corridor in back and forth passes. LiDAR sends out laser pulses and times their return. The result is a point cloud. Each point has a position, a height, and a color from the camera.
The same mark, both years
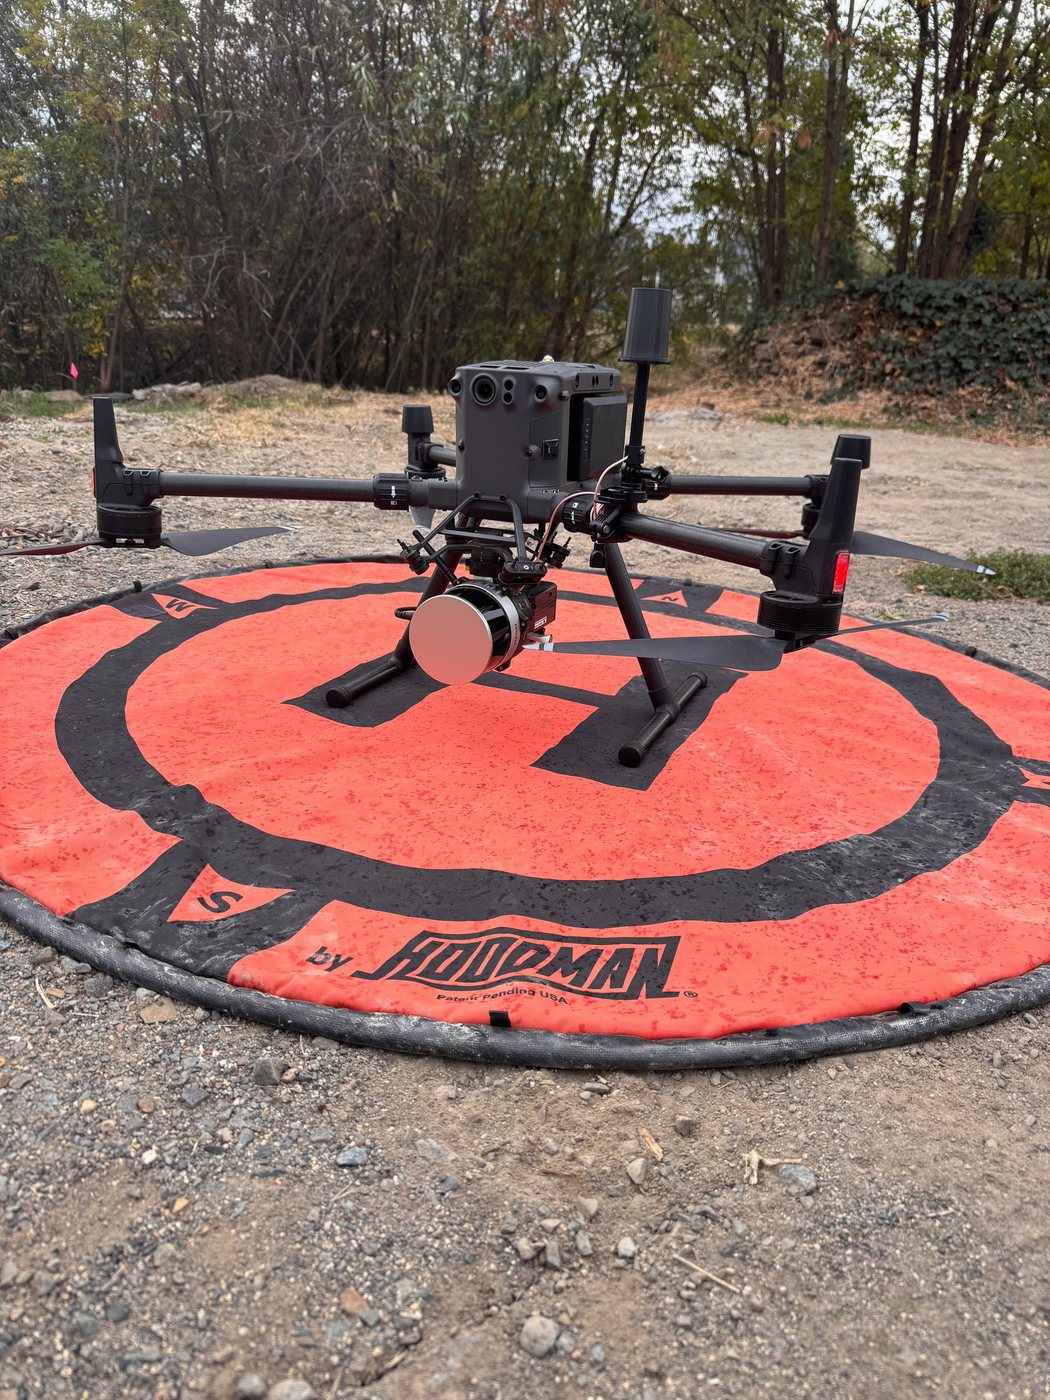
Before each flight we set a base station over the same mark, the lid of a control valve box at the south end. Its record pins down the drone's position after the flight. Using the same mark both years is what lets the two flights be compared.
On open, flat ground the two point clouds agree with each other and with the USGS 2022 LiDAR for Jackson County within 0.01 ft in height. Side to side, the two flights agree within 0.2 ft.
Sorting the points
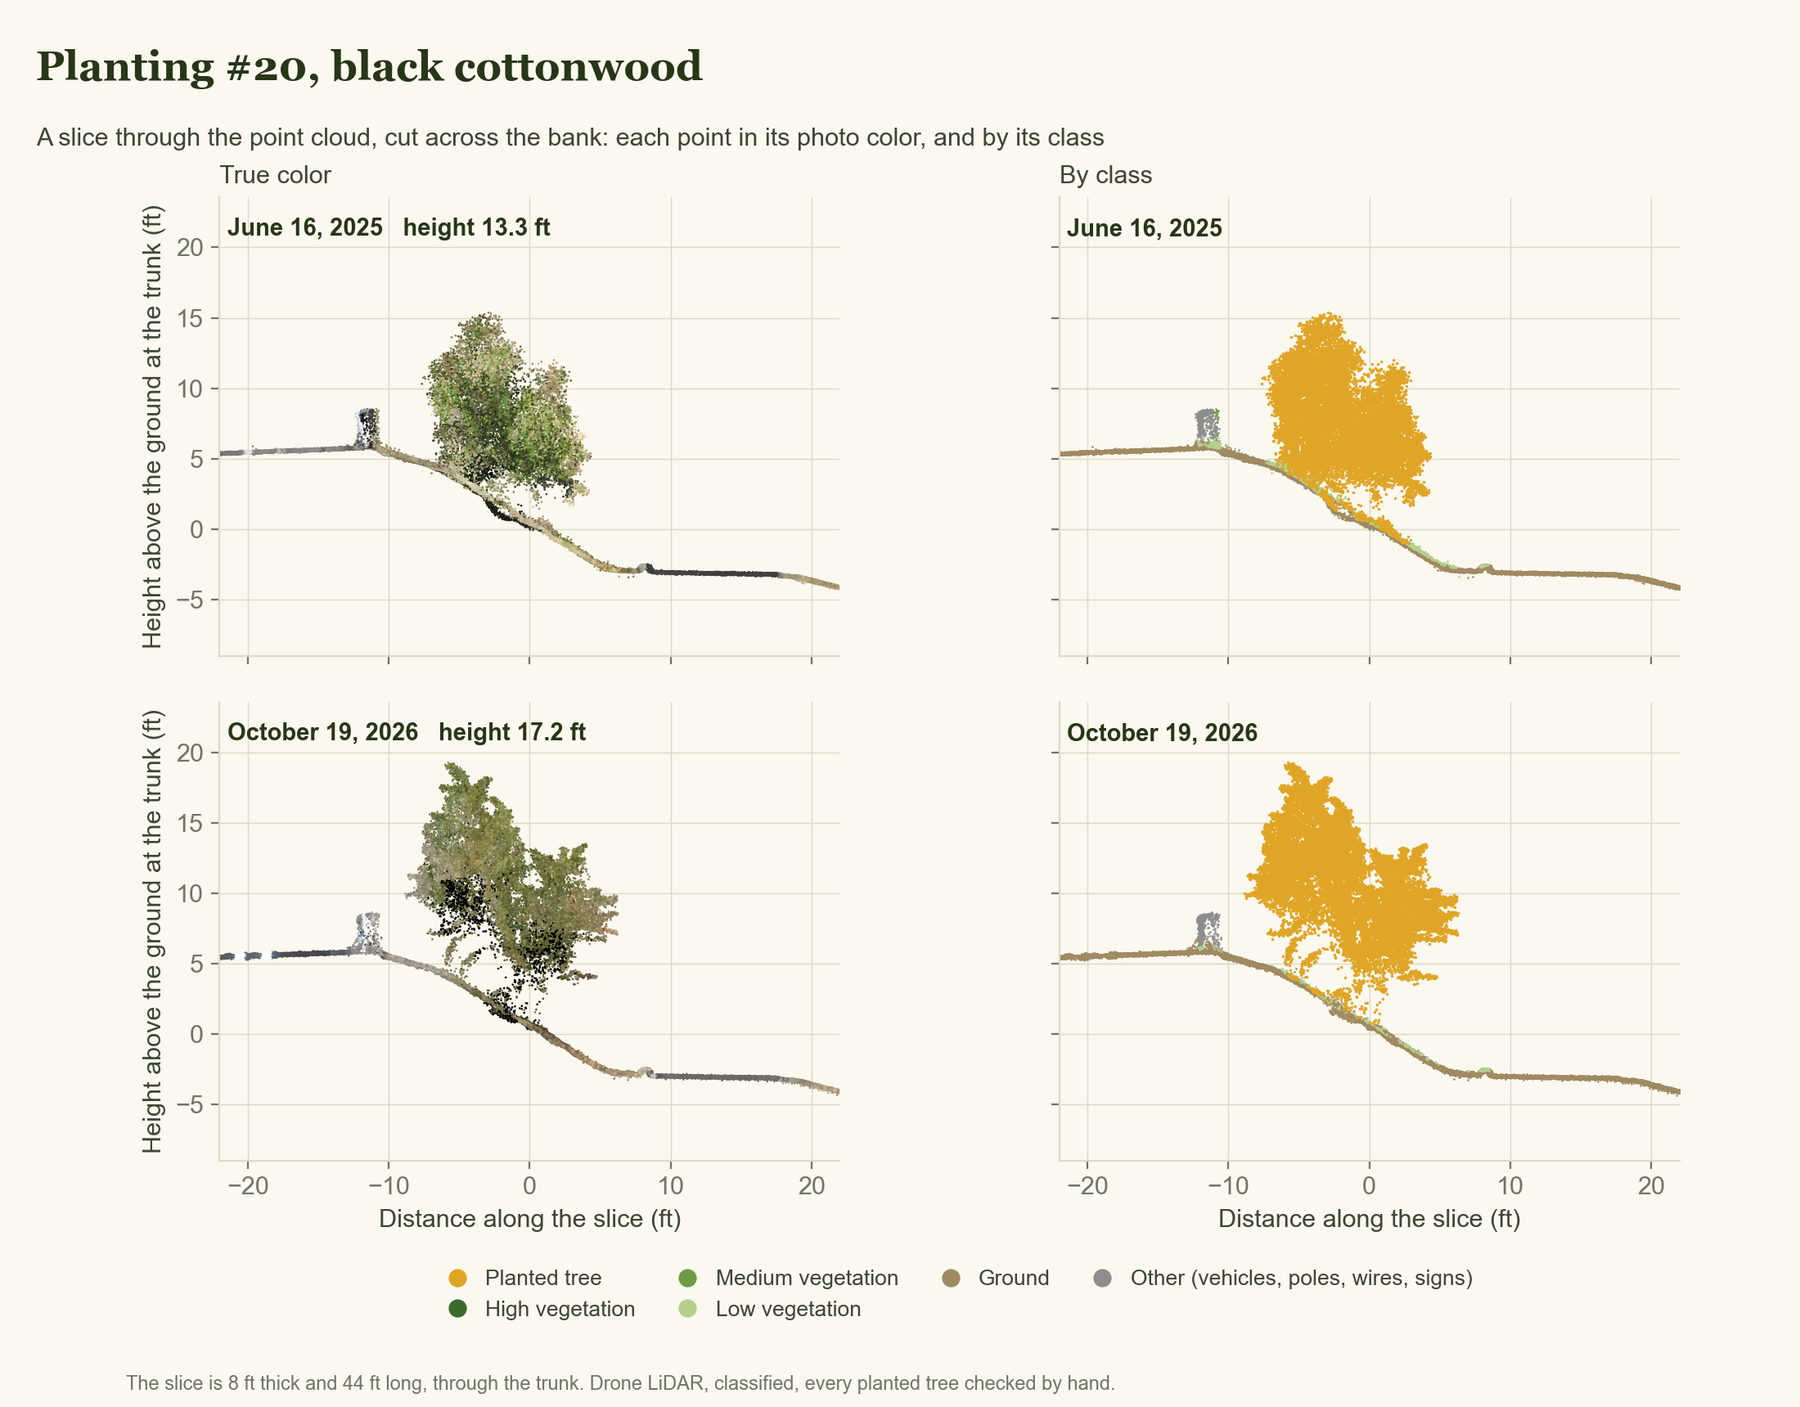
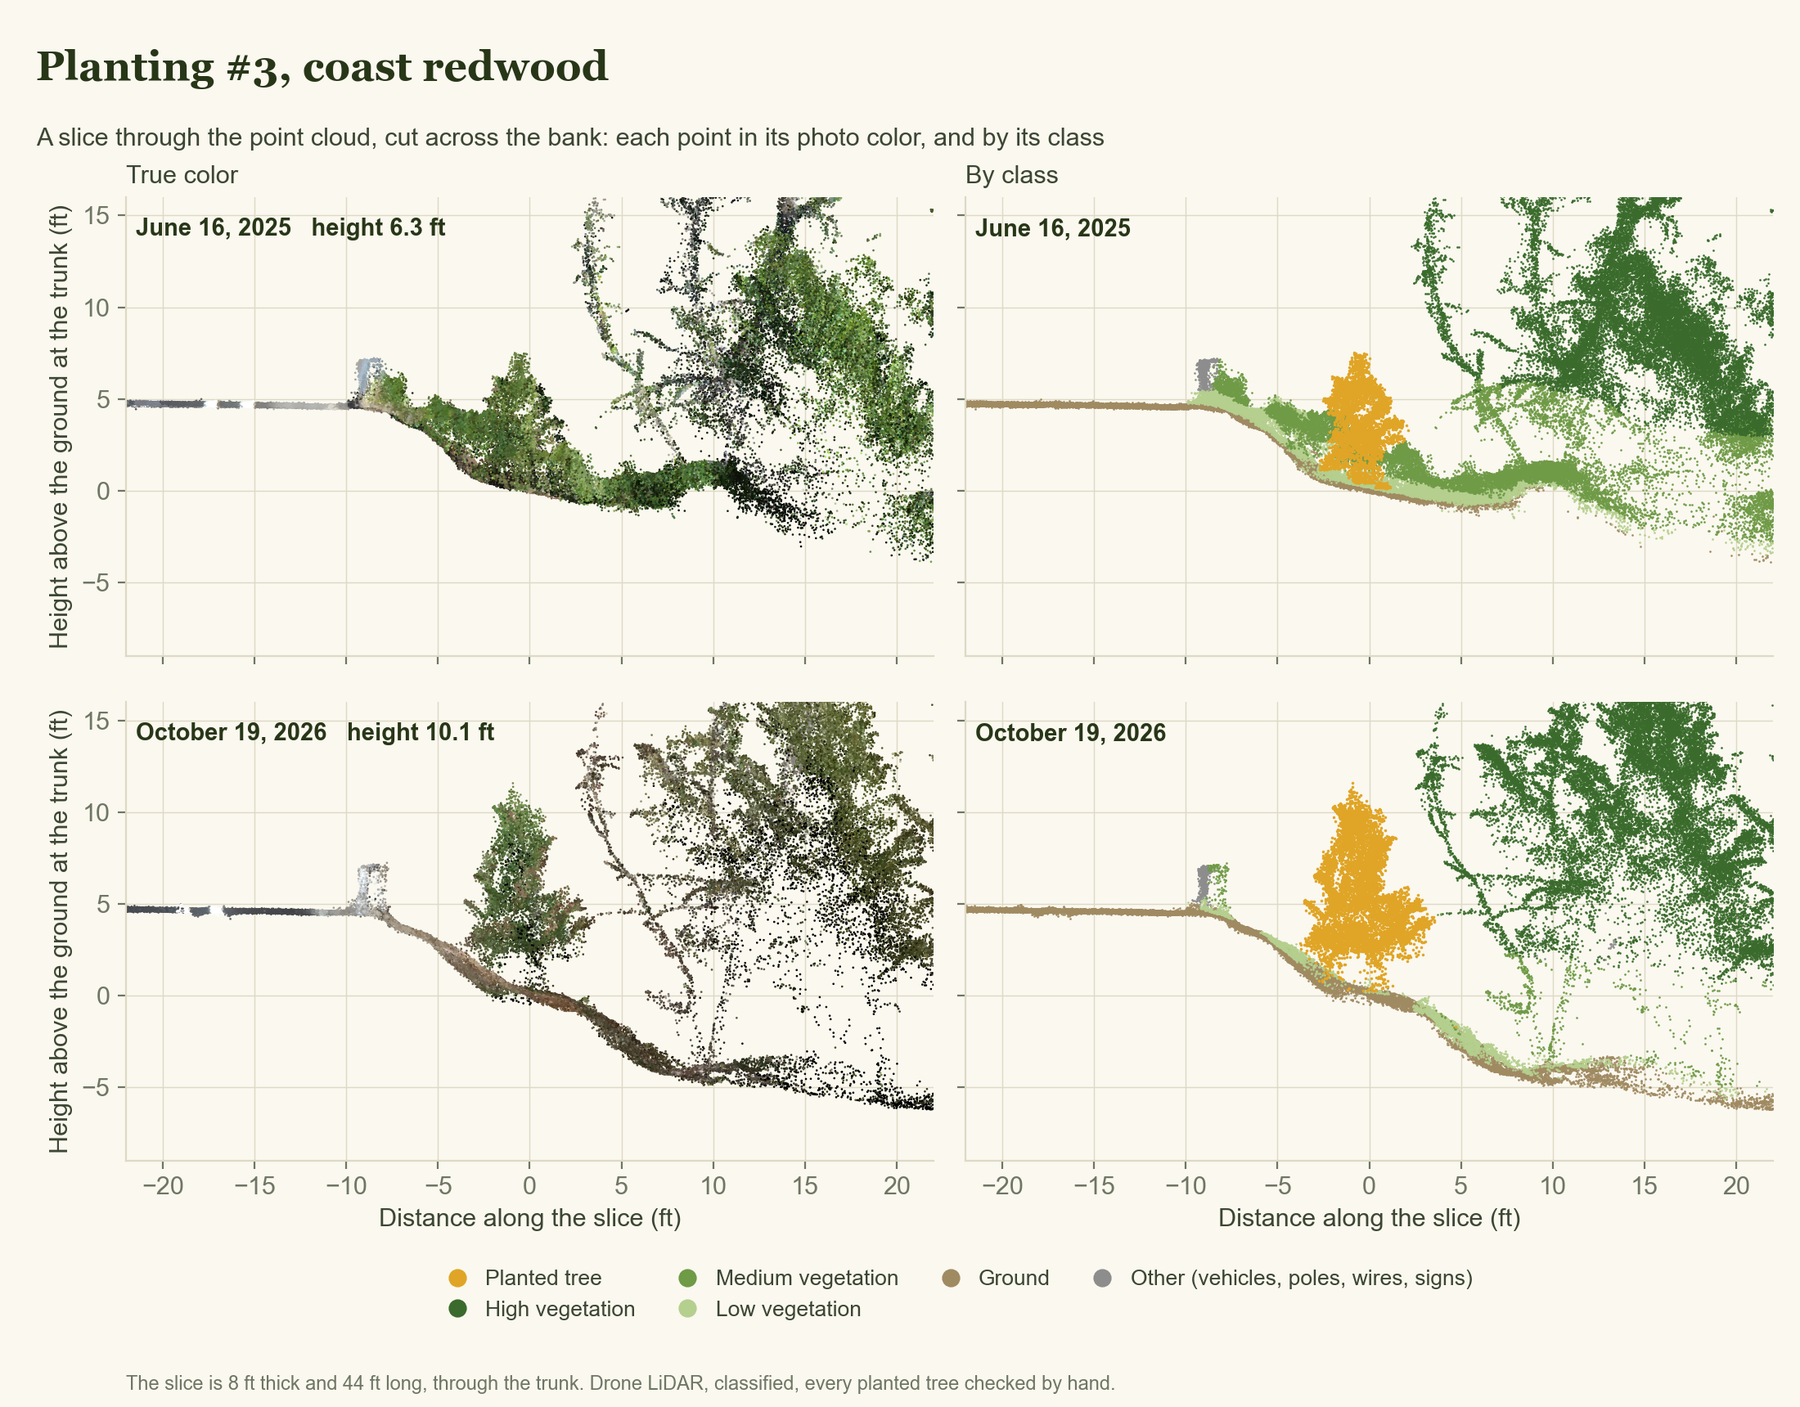
Every point was sorted into a class: ground, low, medium and high vegetation, buildings, water. The 98 planted trees got a class of their own, and each one was checked by hand in both years. That is what lets a single tree be measured apart from the brush around it.
In the 3D view, choose Class to see the sorting. The planted trees are gold.
A slice through the cloud
Cut the point cloud like a loaf of bread and each tree shows from the side: its trunk, its crown, the bank it stands on. On the left every point has its color from the photos. On the right the same points are colored by class.
Measuring a tree
Height runs from the ground at the trunk to the top of the crown. Crown area is the crown seen from above. Both come straight from the points of each tree, the same way in both years, so the change between them is growth and not a change of method.
LiDAR flights, data, maps, and GIS consulting: Rogue Reconnaissance, for OUR Community Forestry and the City of Phoenix, Oregon.
Drag to look around. Scroll or pinch to zoom.
| June 2025 | October 2026 | Change | |
|---|---|---|---|
| Height | |||
| Crown area | |||
| Crown width | |||
| Canopy volume |